kjen.dk
open source
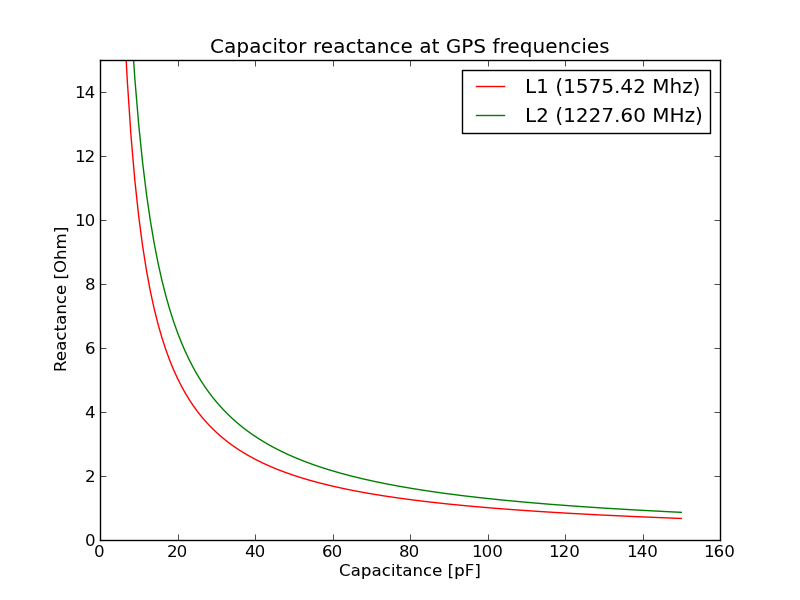
Python code for generating the reactance plot:
from math import pi
from pylab import *

def reactance (f, C):
    return 1./(2.*pi*f*C)

L1 = 1575.42*10**6
L2 = 1227.60*10**6
capacitance = list ((c+1) for c in range (150))
L1_reactance = list (reactance(L1, c*0.000000000001) for c in capacitance)
L2_reactance = list (reactance(L2, c*0.000000000001) for c in capacitance)

plot(capacitance, L1_reactance,'r', label='L1 (1575.42 Mhz)')
plot(capacitance, L2_reactance,'g', label='L2 (1227.60 MHz)')
title ('Capacitor reactance at GPS frequencies')
xlabel('Capacitance [pF]')
ylabel('Reactance [Ohm]')
ylim(0,15)
legend()
savefig ('capacitor_reactance_at_L1L2.png')
show()